The Trend-Line Trap: When Continuity Becomes an Assumption
The trend-line trap turns a visible pattern into an assumed future. Learn to check what keeps it moving and decide when its line needs revisiting.

A planning team pins a chart beside the kettle: requests for remote appointments have risen, so the line continues upwards into the next few years. The drawing is neat. The room is less certain. The trend-line trap begins when a useful picture of the present starts to look like evidence that the same conditions will persist.
A projected line is not a forecast by itself. It is a question about continuity: what would have to stay in place for the pattern to carry on, and what could alter it? Asking that question turns a chart into a tool for examining possible futures, rather than a quiet instruction to plan for only one.
What is the line quietly relying on?
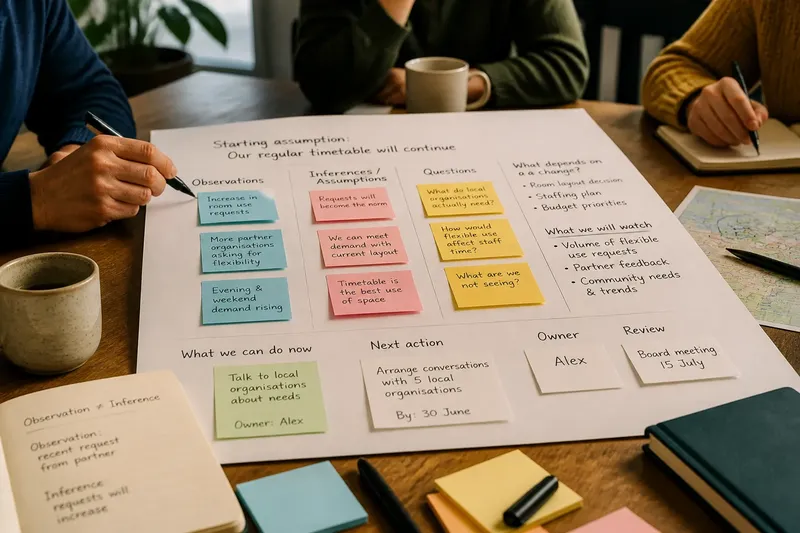
Look at the chart, then look away from it. Ask what must remain true for the pattern to continue. The answer may include a service remaining available, people keeping the same preferences, a rule staying in force, or a resource remaining accessible.
Write each condition beside the trend in plain language. “People will keep choosing appointments from home” names a behaviour that could change. “Demand continues” hides the behaviour inside an abstract phrase.
Keep the list focused on conditions that most directly support the line. Give special attention to those outside the planning team’s control. The point is not to name every imaginable interruption, but to see which dependencies the projected pattern rests on.
Which part is observation, and which part is inference?
A chart often combines a record of the past with an interpretation of what comes next. Mark the boundary. “Requests rose during the period shown” describes an observed pattern; “requests will keep rising” extends it. The second statement depends on conditions that the chart alone cannot establish.
This distinction matters when a signal is recent or uneven. A burst of attention may reflect a temporary disruption, a new service, or a change in how activity is recorded. Those possibilities do not make the signal irrelevant. They do mean that its present shape may not describe a lasting condition.
If the information is sparse, inconsistent or collected differently over time, note that beside the chart. This does not settle what happens next. It helps a reader distinguish a neat visual from a settled account of the present.
How can you test a trend-line assumption?
Use the line as a prompt, not a forecast to defend. For each condition, name an ordinary change that could make it false and an observable sign that the change may be under way. Then decide what the team would do with that sign.
- Check the behaviour behind the line. If the pattern depends on people choosing a particular service and those choices begin to shift, then revisit the projection; if choices remain consistent, keep it as a provisional planning prompt.
- Check access to the service. If access becomes harder because of a rule, tool or resource change, then examine a different line; if access remains steady, retain the assumption while keeping it visible.
- Check who controls the condition. If an outside group can change it, then identify a sign of that group’s decision and avoid treating the line as settled; if the team controls it, decide whether an operational change could preserve or alter the pattern.
- Check how the signal is recorded. If the recording method has changed, then compare like with like before extending the line; if the method is consistent, use the observed pattern with its limits stated.
- Check for another plausible cause. If a temporary event or new process could explain the same shape, then note that alternative and avoid assuming the pattern will persist; if no such explanation is apparent, keep the line provisional rather than certain.
- Check the decision attached to the chart. If the line is being used to justify a commitment, then record its supporting conditions beside that decision; if it is only opening a discussion, use it to explore consequences without presenting it as the expected future.
Imagine a community advice service has a hypothetical starting point: its booking records show more remote appointments in the period on its chart, and the team is considering how to organise future appointments. First, it writes three dependencies beside the line: callers can use phone or video, staff can offer suitable slots, and callers continue to prefer remote contact for the issues they bring. Next, it separates the recorded rise from the proposed continuation and checks whether the booking records were gathered in the same way throughout. Then it chooses observable signs: more requests for in-person help, fewer remote bookings, or recurring difficulty offering suitable slots. Finally, it decides that any such sign will prompt a review of the line and the appointment plan, rather than an automatic change in either direction. The resulting answer is conditional: retain the line as a planning prompt while those dependencies appear to hold, and revisit it if the signs begin to point elsewhere.
What can a changing condition look like in practice?
A condition is changing when the support beneath the line no longer matches what is happening around it. The clearest clue is often a mismatch: the projection assumes an option remains available, but people are asking for another one; it assumes a recording process is consistent, but the process has changed; or it assumes a preference is steady, while choices begin to differ.
That mismatch does not prove the trend has ended. It gives the group a reason to inspect the assumption and decide whether the line still helps with the decision at hand. Keep the observation and the interpretation separate: “requests for in-person help are appearing more often” is a clue to examine, not an explanation on its own.
What questions help distinguish a lasting shift from a temporary signal?
Can a trend continue if its original cause changes?
Yes. Another influence may sustain the pattern after its first cause fades. Treat the cause as a question, and check whether the conditions supporting the line still apply.
What if the signal is a one-off?
A single event can still point to a condition that might recur or spread. Note what further observable change would make it relevant to the decision, rather than extending the event as though repetition were already established.
When should the assumption be reviewed?
Review it when the decision attached to the trend comes up again, or when a relevant condition visibly changes. A calendar reminder can help, but the reason to reopen the line is a decision or an observation that bears on its assumptions.
When should you leave the line on the page?
Do not discard a trend simply because its future is uncertain. A provisional line can make a consequence easier to discuss: if the pattern continued, what might become difficult, attractive or worth preparing for? Exploring that possibility is different from treating it as the most likely outcome.
You can keep the present pattern extended forward alongside a short note about a condition that could interrupt it. This is not a full scenario exercise. It is a way to show that the line depends on circumstances, rather than allowing its neatness to settle the discussion.
When a chart informs a real commitment, record the assumption beside the decision. A person returning to the plan can then see why the line mattered and what observation would prompt a fresh look. The trend-line trap is easiest to catch when a smooth line starts to feel inevitable; pause there, and ask what would need to remain true for it to continue.